Questions about how to use macbethcal properly?

I have been reading Rendering with Radiance and I am eager to learn how to define my own materials accurately. However, as I continue to read, I have many unanswered questions! I’ve listed the basic ones below, and I hope the community can help clear things up for me.

Question 1: I’d like to confirm the limitations of the macbethcal measurement technique. Is my summary below accurate?

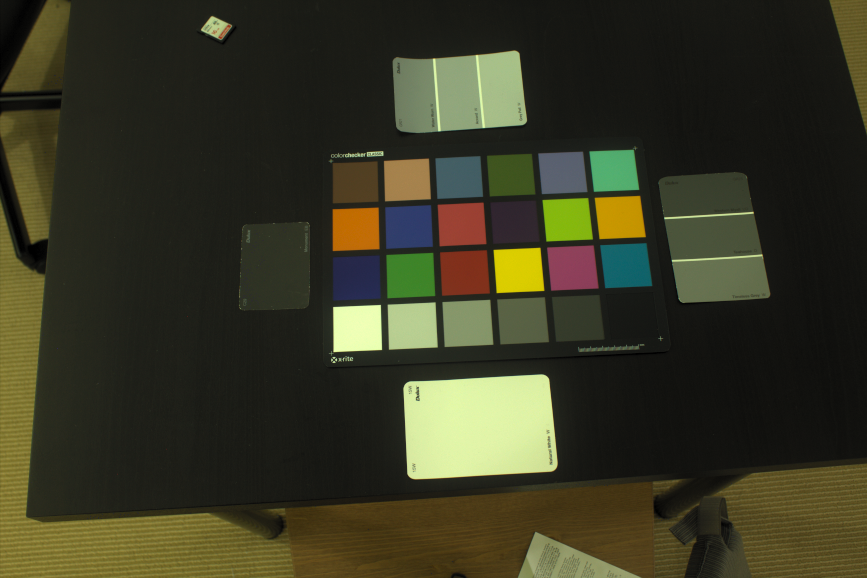
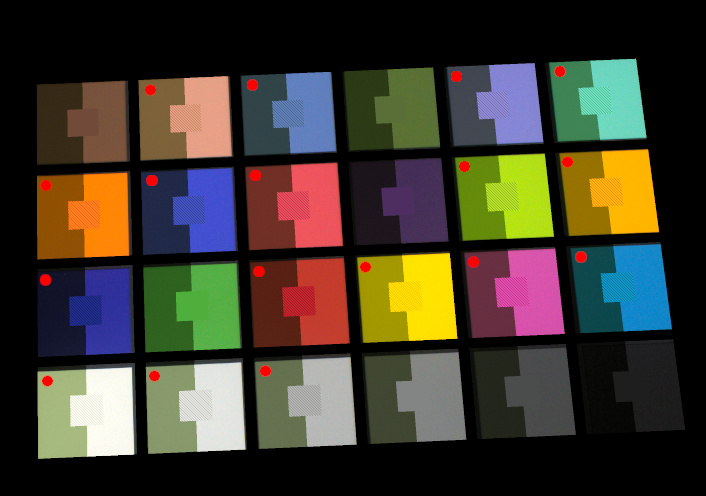
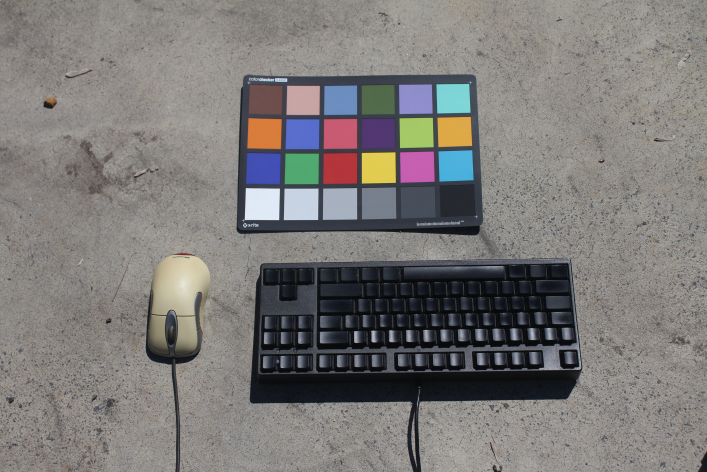
I can photograph a Macbeth chart under the same photography settings and environment as my object. The macbethcal program will detect the chart and generate a calibration function, which I can run on the photo of my object, and sample the average RGB values from there. I can then use these RGB nubmers to define my material.

This implies that the c command in X image directly returns the hemispherical reflectance RGB with no further calculation required. If my object is not a planar surface (e.g. a spherical rock) or has non-uniform lighting, it will have variable RGB colors due to self shading, specular highlights, and as a direct consequence of the non-uniform lighting. This would therefore decrease the accuracy of the method.

Can I mitigate this by only sampling a portion of the material in the same plane as the chart, where I can see that self-shading and specular highlights don’t occur?

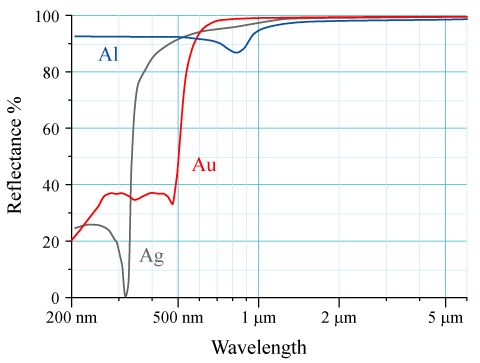
As the object approaches very specular, e.g. stainless steel, I suspect the macbeth method is useless as the colors would be of the reflected objects, not the actual material itself. For this, I assume I can just use existing material libraries and known metal values.

Question 2: If the macbeth measurement method is used, why would you still use the greyscale chart method?

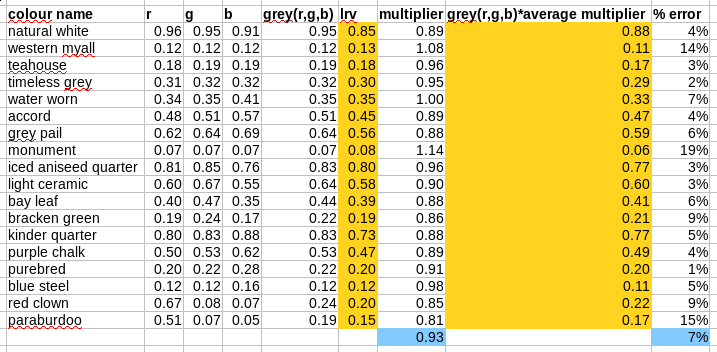
The only reason I can think of is to perform a sanity check of the average reflectance. The book suggests that a 10%-increment greyscale chart can give a reflectance of within 5%. It also suggests that the macbethcal method only gives 10% accuracy.

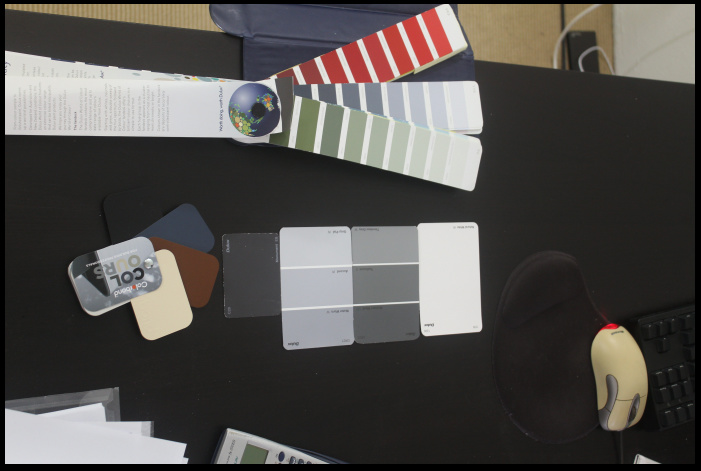
Question 3: Where can I get a greyscale chart?

I’ve never seen one before, and the warning in the book suggests that the munsell chart shows “luminous reflectance”, not, uh, I guess, “hemispherical reflectance”, and so is inappropriate. What is “luminous reflectance”, and how do I know that the greyscale chart I am looking at shows the right type of reflectance? Also, can somebody link me to a greyscale chart available online, because my preliminary searches at local art supply stores (in Sydney, Australia) have turned up blank.

It also says I can build my own chart from neutral density samples from a graphic arts ink suppliers. Can anybody show me some examples of where to get these? How can I guarantee they represent a known hemispherical reflectance?

Question 4: How would I apply an image pattern calibrated with macbethcal?

If the image pattern is already calibrated, it should already contain accurate RGB reflectances. Therefore, what numbers should I put in the “bar” material below? From my current understanding, colorpict multiplies the reflectance values (linearly, I would assume?). Therefore, should I put 1 1 1 in bar?

void colorpict foo
7 red green blue foo.pic . frac(lu) frac(lv)
0
0

foo plastic bar
0
0
5 ? ? ? 0 0

I hope it all made sense, and sorry for the long post!

Wow, diving into the deep end, I see…
Generally speaking, the macbethcal program works well for scanner input and calibrated cameras, but not that well for uncalibrated consumeer cameras, which apply a lot of non-linear operations in their image processing. If you capture camera RAW from a DSLR and process using Dave Coffin’s dcraw program, you can get decent results, but you have to be really careful to ensure that you have uniform lighting on both the Macbeth chart and whatever it is you are attempting to capture. There is a somewhat outdated reference on material measurements here: http://radsite.lbl.gov/radiance/refer/sg96crs.pdf
Q1: macbethcal has a default image location for the chart, but does not “find” it automagically. You are better off specifying the corner points and checking the debug output to make sure it’s doing it right. The only lighting I’ve found to be reliably uniform besides a scanner is direct sunlight, and that’s what I recommend.
Q2: You don’t need the grayscale chart method if you use a Macbeth chart.
Q3: X-rite sells all sorts of charts.
Q4: Your instinct of using “1 1 1” for the material is correct.

Thank you Greg! I have seen that paper mentioned on this forum before and it was fascinating! I have ordered a colour chart and will sit tight until it gets delivered.

Meanwhile, I happen to have some “Colorbond” samples from Bluescope steel. They are a large manufacturer famous in Australia but operate globally, and their steel building products (e.g. corrugated roof sheeting) are available in colours from their “Colorbond” range. The theory outlined in the book is that you can calibrate to any known reference material. I guess the Macbeth chart is so useful because it provides many references simultaneously to check and minimise errors on. In the meantime, I thought I would try calibrating a photo based on the Colorbond samples.

I took a RAW photo with a DSLR with no white balancing in full manual mode with any “automatic” correction settings I could find turned off. The photo is below. It was taken indoors, lit by white florescents at the other end of the room that were diffused over the walls (no overhead lighting).

2018-08-23-000102_561x374_scrot

Colorbond doesn’t have known RGB reflectance values, but it has a brochure here https://colorbond.com/sites/default/files/pdf/brochures/colorbond_steel_colours_for_your_home_colour_chart.pdf that shows the Solar Absorbtance (SA) values for each material. Solar absorptance is defined as the inverse of solar reflectance, expressed as a ratio between 0 and 1. A SA value of 0 indicates that a roof absorbs none and a value of 1 indicates that a roof absorbs 100% of the incoming solar radiation. My naive guess is that the solar reflectance (i.e. 1 - SA) sounds similar to average hemispherical reflectance. I wrote down the reflectances below for each sample.

# Black (Night Sky), 1-SA = .04
# Blue (Deep Ocean), 1-SA = .25
# Brown (Terrain), 1-SA = .31
# Cream (Classic Cream), 1-SA = .68

I then converted the RAW .cr2 file to a .ppm using dcraw -w img.cr2. Then I used ra_ppm -r img.ppm img.pic. I sampled a uniform area over each colour and I’ve listed the R, G, B, and calculated grey(R,G,B) values below.

# R,G,B,grey(R,G,B)
.02,.02,.04,.0212962249
.05,.07,.15,.0698834169
.17,.08,.05,.101912334
.94,.96,.84,.946921168

I was hoping that they would be directly proportional to the reflectances I got from the brochure. Alas, an initial glance at the cream-color shows that it is much brighter than all the previous, and so my little experiment didn’t work :frowning:

Disregarding the cream as an outlier, I arbitrarily chose to calibrate the brown (I guess I could find a multiplier than minimises errors), so my desired reflectance is .31, and my measured reflectance is .1019, giving a multiplier of 3.04. If I multiply the component RGBs of the four samples and recalculate grey(r,g,b), I get the below. Not entirely useless, perhaps?

.0608,.0608,.1217,.0647 (compared to .04)
.1521,.2129,.4563,.2126 (compared to .25)
.5171,.2433,.1521,.3100 (compared to .31)
2.860,2.920,2.555 = Garbage, of course, as each RGB component > 1

I hope you can shed some light if my manual experiment is similar to macbethcal, and where I have made mistakes in the methodology! :slight_smile:

Hi Dion,

please be aware that the (radiometric) solar reflectance may have little
to do with (photometric) visible light reflectance. The latter considers
only a part of the solar spectrum (400nm) and accounts for the spectral
response of the human eye’s receptors.

Best regards, Lars.

1 Like

A good example of Lars point can be seen in a chart like this. The chart implies that the total solar reflectance of Silver, Gold, and Aluminum might be relatively similar, but gold has a notably different reflectance within the visible range around 400-800 nm.

I’d be suspicious for a painted metal that the reflectance in the infrared, which could dominate solar reflectance, would relate more to the substrate and the base of the paint than the paint’s pigmentation. (I’d be curious if anyone would agree or disagree with this, particularly with any evidence)

Hi Lars and Christopher! I see. Garbage in, garbage out!

I decided to look for a more specific definition of what is the “RGB” that Radiance defines for plastic materials. However, the only definition I have read so far in the book is in chapter 5, p290 where it says:

The precise name for the unit of reflectance that Radiance uses for input is hemispherical reflectance, which refers to the ratio of total flux leaving a surface to the total flux incident upon a surface as measured by a spectroradiometric device when illuminated by an equal-energy light source.

It makes no mention of the visible range! When I checked the Wikipedia page, https://en.wikipedia.org/wiki/Reflectance#Hemispherical_reflectance it says it measures the radiant flux https://en.wikipedia.org/wiki/Radiant_flux which is a radiometric quantity, measured in watts. Yet you are suggesting that Radiance is looking for a photometric reflectance!

Where can I find the definitive definition of the RGB reflectance units in Radiance?

I think I have found the definitive definition of what the “RGB reflectance unit” is in Radiance. Please correct me if I am wrong:

I see that the book recommends using a spectrophotometer to measure RGB reflectance, which supports your definition of a photometric measurement. It explains how the measured unitless reflectance across different wavelengths is then processed by cieresp.cal and xyz_rgb.cal. The former seems to convert the reflectances to a single CIE XYZ value (I guess CIE XYZ is arbitrary, it could equally well be CIE xyY), bounded within the range of 360nm to 830nm, and no luminosity function is applied despite being defined in the file. Instead, only the trix, triy, and tryz functions are used. The latter script then converts the CIE XYZ to RGB radiance values, in the unit of W·sr^−1·m^−2.

I decided to repeat my test above, but instead of using Colorbond I am using Dulux samples (from Dulux Australia, which has different products to Dulux elsewhere). Here’s the new photo I took and processed with dcraw -w, the converted with ra_ppm -r.

The Dulux website https://www.dulux.com.au/specifier/search/top?query=natural+white&charset=UTF-8 allows me to search for each colour, and it will say what the Light Reflectance Value (LRV) https://en.wikipedia.org/wiki/Light_reflectance_value is for that colour. The definition of LRV is basically the “Y” component in the CIE xyY coordinate. https://www.dryvit.com/fileshare/doc/design/colors/us_LRV_light_reflectance_value2.htm From my current understanding, this “Y” component is the average reflectance, i.e., it is what grey(r,g,b) in rayinit.cal calculates. The only difference in definition I can find between the average reflectance grey(r,g,b) for a Radiance plastic material and the LRV is that an LRV includes the specular component, whereas the plastic material RGB should be purely the diffuse component.

Therefore, and please correct me if I am wrong, if I wanted to produce a scene in Radiance where surface colour is not important, I can directly use the LRV values for any non-specular Dulux paints in my scene. So I tried my experiment again, attempting to achieve the LRV for each colour.

My results are below. I arbitrarily picked a bunch of colours. The r, g, and b column shows the results of the c command in ximage when I have sampled areas above those colour swatches in my photograph. The grey(r,g,b) column is the calculation I get, and the lrv column is what the Dulux catalogue says it should be. The multiplier is lrv / grey(r,g,b), and highlighted in blue is the average multiplier. As you can see, the average % error in reflectance when I apply my average multiplier is 7%. This is skewed by the higher percentages in the darker colours for obvious reasons.

Is this a sensible result and methodology? Are these error ranges fairly typical for a photograph? The average multiplier is a simplification, I’m sure macbethcal does something cleverer :slight_smile:

This makes sense, and your errors seem to be in a reasonable range given your process. Using dcraw with ra_ppm, you won’t get precisely linear results. To get more linear results, use “dcraw -4” and “ra_ppm -r -g 1” to convert to a Radiance HDR picture. This stays close to RAW all the way, never going through a non-linear quantization step.

Thank you Greg! The Macbeth chart arrived today, so I decided to try it out. I used your commands dcraw -4 and ra_ppm -r -g 1. Note that as per your suggestion, I am not using the -w argument in dcraw, which means that the resulting ppm has a funny white balance. Here’s the picture I took.

The sequence of commands I ran:

$ dcraw -4 IMG_5450.CR2
$ ra_ppm -r -g 1 IMG_5450.ppm macbeth.pic
$ macbethcal -d debug.pic -p 1984 2498 3811 2576 1987 1346 3964 1434 macbeth.pic macbeth.cal

Unfortunately, when I run macbethcal it says:

macbethcal: cannot compute color mapping
macbethcal: warning - some moderate colors are out of gamut

Here is the result of debug.pic. I have scaled it down with pfilt to fit on the forum, however this has made the diagonal black lines a bit hard to see, so I have marked the ones that are out of gamut with a red dot. As you can see, quite a lot have issues, including half of the bottom row! I am also unsure why it says “cannot compute color mapping”, as it does actually produce a macbeth.cal file, and visually the results don’t look too bad in debug.pic. Does this mean my output macbeth.cal is garbage?

If it helps, I am shooting RAW with a Canon EOS 550D. Why are these issues occurring, and what can I do to mitigate it? I have already tried to make my lighting as uniform as possible (but alas, it is indoor flourescent lights), and also attempted to use an ISO setting of 100 to prevent noise.

I have included the RAW image for anyone who would like to see the original file :slight_smile: https://thinkmoult.com/filebin/IMG_5450.CR2

The indoor fluorescent lighting is the most likely culprit. You need full-spectrum lighting to get a good set of colors, and fluorescent lamps have a notoriously spiky spectrum. Take it outdoors in direct sunlight (if you can find some where you are) and see what that gives you.
As you say, the macbethcal program will complain if it isn’t happy with its mapping, but it will still do the best it can with what it’s given.

The Macbeth Color Checker was originally referenced to CIE illuminant C, which is hard to find. (It could be reconstructed but, big nuisance.) Illuminant C was an approximation of morning or afternoon clear-sky daylight at perhaps 10am or 2pm, so I would say try that. A D65 illuminant, if you have one available, might be pretty close. But try morning or afternoon daylight first.

I did some informal testing of macbethcal years ago and saw great
results using afternoon clear sky daylight. I don’t have the test
results on hand but it worked really well (as opposed to when I first
tried it under electric lights of various sources and distributions,
which all sucked).

I cannot find my test results, so this is anecdotal, free, and worth
every penny. Happy Friday.

  • Rob
1 Like

Thank you all - you are absolutely correct, with daylight, the results are much better! Unfortunately some of the materials I am measuring are indoors, and I don’t have portable samples, so for now I will have to live with a margin of error.

There are two manufacturers that make D65 illuminants; they are costly but not exorbitantly so. If you’re feeling determined, you can use these indoors.

JUST Normlicht sells D65 fluorescent tubes (and viewing booths, and so on.) Link

Waveform Lighting sells 800 lumen LED modules, link.

1 Like

Cool, thanks Randolph! I could see a group buy of those Waveform
modules… A small sample box could work with just a few of those 12"
strips, maybe?

Thanks Randolph! Not quite yet, but yes in the future I will definitely buy one of those LED strips. That way I will be able to take more accurate indoor measurements :slight_smile:

So far, I’ve measured the colours for diffuse, flat surfaces (walls, floors, fabrics).

How would I measure the colour of a specular surface accurately? Say for example a brushed metal or shiny plastic? My current understanding is that specular reflections occur at the expense of diffuse reflections, so if an object is very specular, it doesn’t matter if my diffuse RGB is quite inaccurate, as it will not show too much. (With the exception of metals, which affects the specular highlights, but I guess there is a well known table of various metals and their colours)

Also, what is the shape is curved? Like if I wanted to measure the colour of a cylindrical post, or object which has many ridges on it?

Specular and diffuse reflections often have very different color content, which is why many spectroreflectometers have SCI (specular component included) and SPE (specular component excluded) measurements. Subtracting the two, you can come up with an estimate of the specular color, but it’s tricky to do in practice.

Thanks for your reply, Greg. Sorry for the slew of beginner questions, but I am just wrapping my head around these concepts.

The question I was really asking was let’s say I had an irregularly shaped, shiny, opaque, plastic object, how would I measure the R, G, B, Specularity, and Roughness values to define the plastic material in Radiance? If the object were flat and diffuse, I could use macbethcal under uniformly lit daylight to measure R, G, B, and guess a very small value for Specularity. If the object was flat and specular, and if I had an expensive spectrophotometer, I could measure the SCI to determine the R G B (edit: this is an assumption, I think that the SCI value is equivalent to the R, G, and B value in Radiance, if not, please correct me!), and then I think I can do (SCI-SCE)/SCI to determine the Specularity, and then estimate the Roughness value.

However, what if the object is both non flat and shiny (like if I wanted to determine the R, G, B, and Specularity of my computer keyboard), and I don’t have access to a spectrophotometer? What technique can I use then?

Here’s my imagined workflow, you can tell me if the method sounds sane or not :slight_smile: I assume I need to emulate the same principles as an integrating sphere spectrophotometer, without actually having access to the equipment. I found a diagram online explaining how it worked:

2018-09-08-212627_530x348_scrot

Therefore, I assume I could measure it similarly with a camera and macbethcal, taking the following precautions:

  1. First, I would take the photo under a perfectly cloudy day, such that the sky is uniformly lit.
  2. I will take the photo at an angle, but ensure that nothing is reflected on the specimen except for the uniformly lit sky.
  3. Then I would use the macbethcal method to measure a portion of the irregular surface that is as co-planar as possible to the macbethcal chart, that does not have any self-shadowing on it. This, I believe is equivalent to measuring the SCI, which will give me the R, G, and B values.
  4. Then, I would place a diffuse object with a very low reflectance (the darker, the better) such I can see it being reflected in my shiny specimen, but not so close as to overshadow the specimen. This, I guess, is analogous to “opening the port” in the integrating sphere. I will calibrate the result with the macbethcal generated from the previous photo, and that will give me a new R, G, and B value, that I will call R_SPE, B_SPE, and G_SPE. These values will not be perfectly the equivalent of SPE, as the specimen is not flat, and the dark object will still reflect some light, but it may be “close enough”.
  5. Calculate ( grey(R,G,B) - grey(R_SPE,B_SPE,G_SPE) ) / grey(R,G,B), to give me the Specularity.
  6. Guess the Roughness value.

This method would only work for very shiny objects outdoors where you can see reflections clearly. For other slightly shiny objects (like my computer keyboard or desktop monitor), I have no idea how to go about it. Maybe build that black box and guess based off a simulation.

Is any of this valid? Or am I approaching this completely wrongly?

I took a few measurements of things like my keyboard, mouse, and monitor with macbethcal, and I’ve unfortunately had to make quite a few guesses. In a render, it turns out pretty decent, but I still feel confused (and guilty that I am guessing) about how to properly measure specular materials.

Here’s an example of my keyboard and mouse:

The RGB value of the keyboard varies quite a bit depending on whether I sample a shiny part (reflecting the sun) or a non shiny part (reflecting the sky). Where should I be taking the sample? Is there a way to guess the specularity from the ratio of the shiny RGB to non-shiny RGB?