Hi everyone,
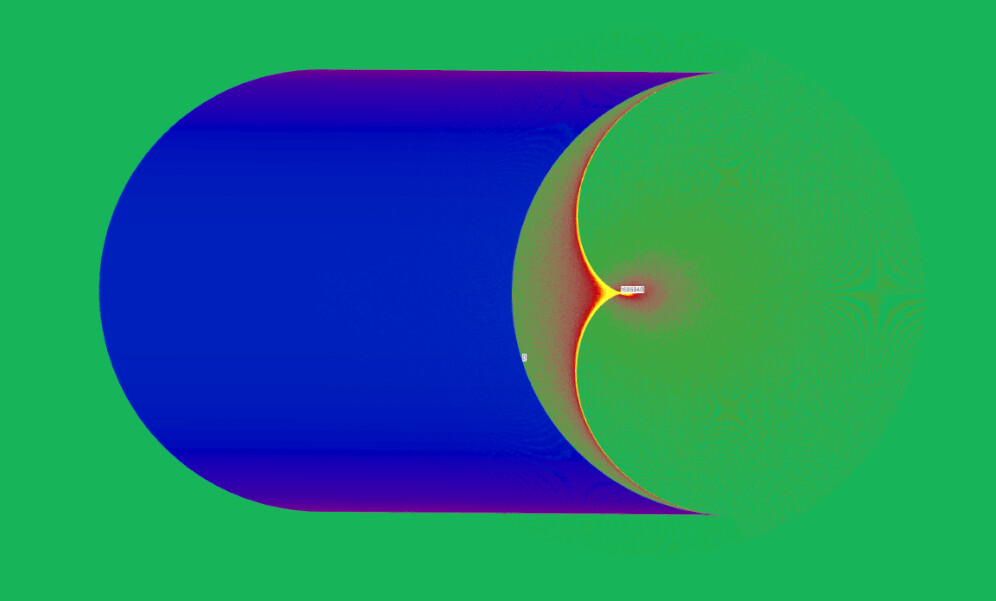
I am rendering a very simple scene formed by a cylindrical reflective surface and a floor. For rendering it I have also used a simple code (I have not used photonmapping although it is specific for caustics because I had problems, that I commented in other post Photon Mapping differences between two images, with that module ):
gensky -ang $elevation $azimuth +s > 01A-Luz$n.rad
oconv 01A-Luz$n.rad 01B-Outside.rad 01C-Materiales.rad 00A-Fachada180.rad 00B-Suelo.rad > 02-Escena.oct
rpict -i -vf 03-Vista.vf -x 4096 -y 4096 02-Escena.oct > ./Render/04-IImagen$azimuth-$elevation.hdr
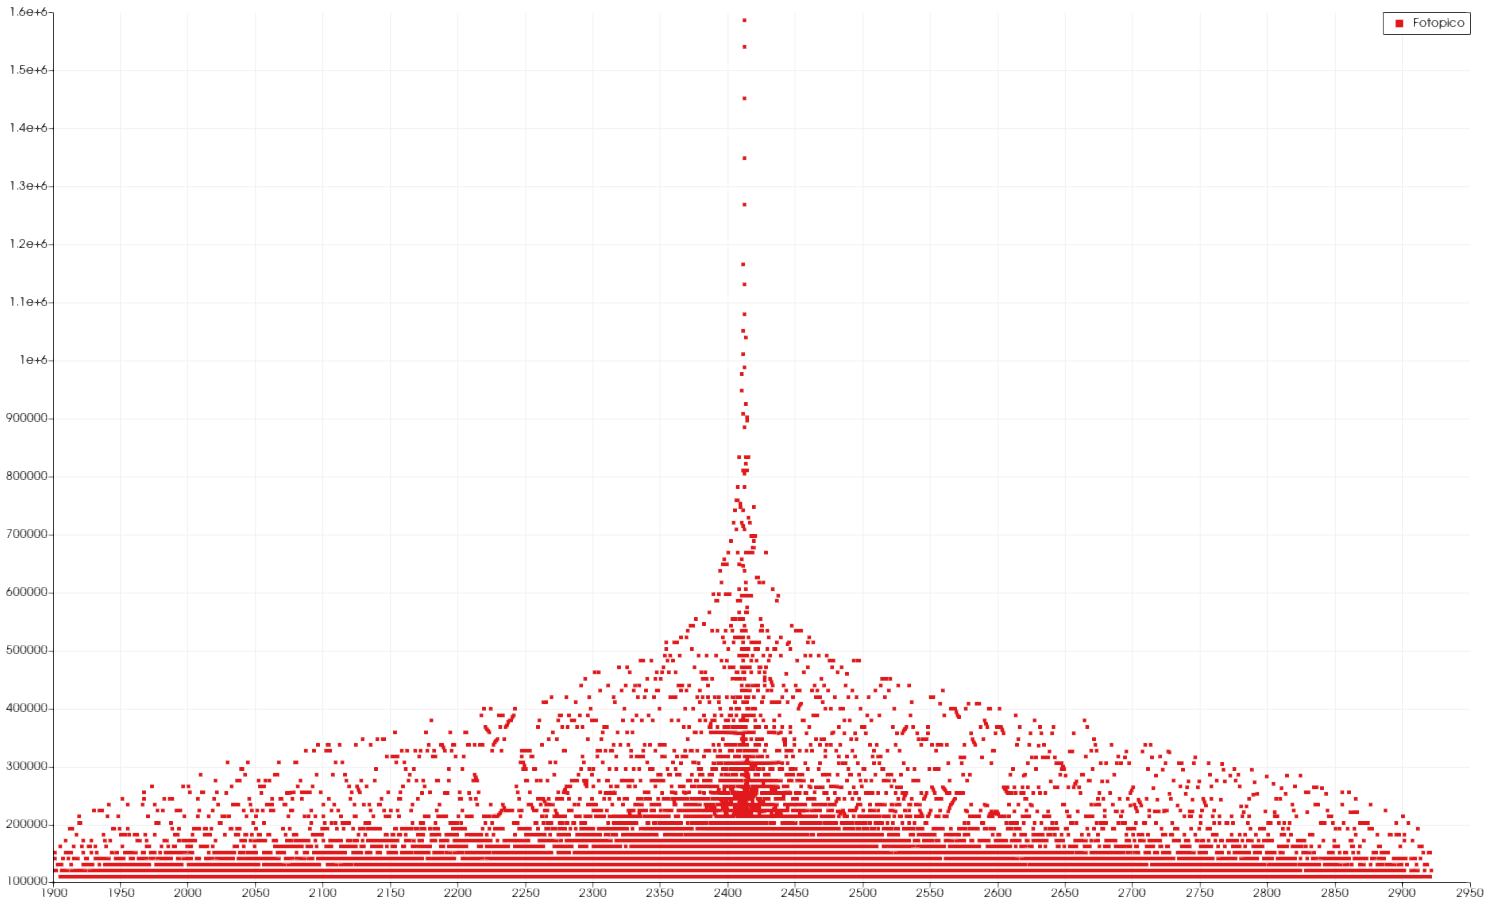
When I look at the falsecolor image, everything seems normal but when I have analyzed the values, I have realized that those values seem to be limited in a range of values instead of been continuous.
In this image the x-axis corresponds to the y-coordinate and the y-axis to the illuminance (all values below 100000 lux have been omitted).
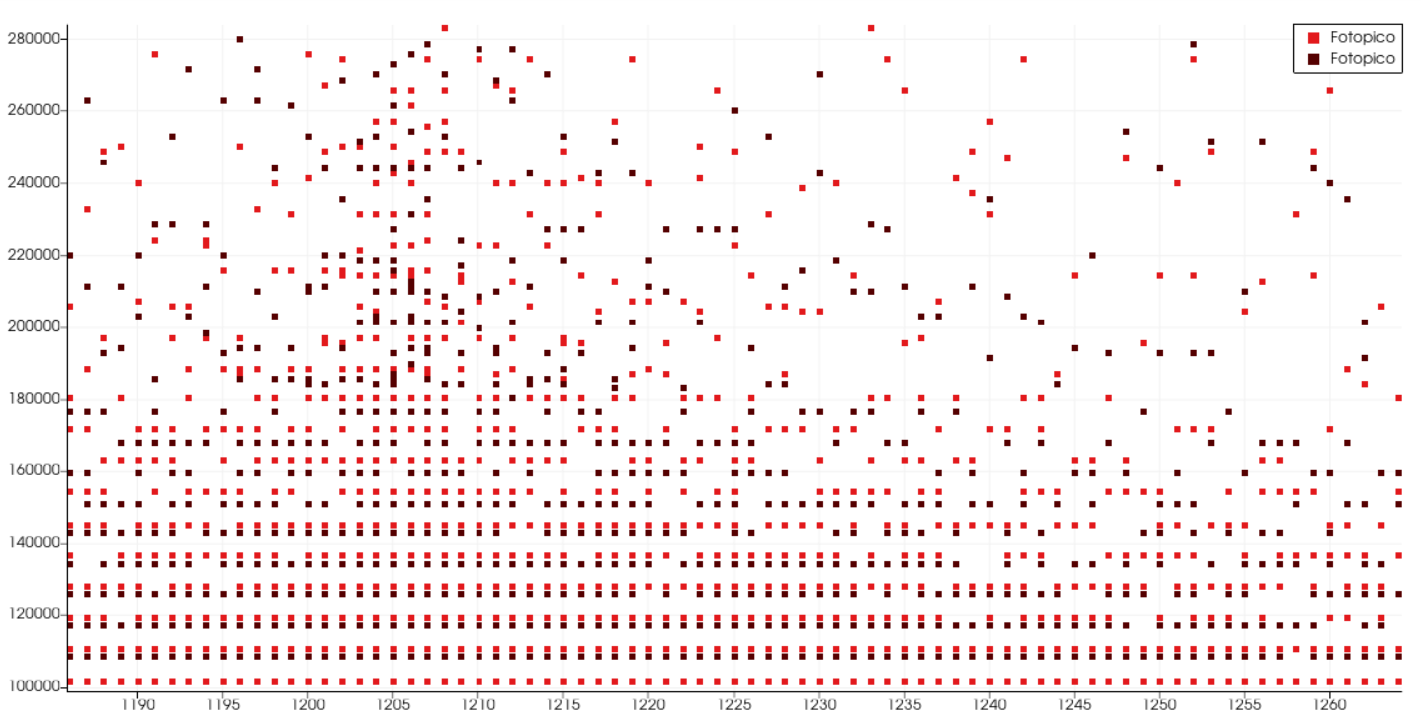
If we zoom in on the graph, we can see that the jumps are about 10000 lux, except in some areas where intermediate values do appear. What could be the reason for this?
Thank you in advance.
If this came from an HDR image, the steps are easily explained by the roughly 1% precision of the RGBE data format. The in-between points may be different color values in that case.
Cheers,
-Greg
Thank you very much for the explanation, I think I understand why this happens.
However, when I compare this image with another one in which I have varied the elevation 0.05 degrees, the steps also occur but they do not correspond exactly with those of the previous image. Is this also normal, why does it happen?
Well, the precision isn’t exactly 1% – like all floating-point representations, it varies in a sawtooth like pattern based on where you are in the mantissa’s range. The RGBE encoding is further complicated by the shared exponent, which means maximum precision is only maintained on the dominant primary. I don’t think this matters in your case, however.
If you want better accuracy, you can always use vwrays with rtrace and save floating-point output rather than RGBE images.
Hi,
We have continued to examine this issue and we have been analyzing the resolution of the values, with regards of the value of the magnitude. The distance between the discrete values of R, that is, the delta of R (in RGB, the same happens with G and B) as a function of the value of R, since we could see that the greater the illuminance, the greater the interval of the jumps. By analyzing this value of the delta of R in several cases, we were able to obtain a graph like this one, where it is seen that the jumps of the value of R remain more or less constant in certain intervals of R and at specific points this value of delta of R increases. The graph shows the delta of R on the ordinate axis and the value of R on the abscissa.
Of course it would be great to have a fixed resolution, independent of the value of the magnitude, or at least that the jump in resolution was not so abrupt, but we need at least to know if the program is rounding or truncating the values, in order to try to take into account and correct for the lack of resolution.
Hi Irene,
The code that translates to and from the 4-byte RGBE representation is in src/common/color.c from lines 262-317. You can download the code from the CVS link. The encoding does effectively employ rounding.
This representation is designed to be compact, cover a wide dynamic range, and have errors at or below the human visibility threshold. It is not designed for high precision, obviously. Again, I can recommend using vwrays with rtrace and floating point output if you need greater accuracy.
What program is ingesting these values? Are you using pvalue to convert them, or your own code?
Best,
-Greg
Hi Greg,
Thank you for your answer and your patience. I tried using vwrays with rtrace and floating point output as well as double point output but I don’t know how to read those files, only with the ASCII output I was able to read the file.
The results of the graph have been obtained with pvalue and I’ve used Paraview and Excel for the graph.
Cheers,
Irene
Hi Irene,
Yes, you would need one of the other Radiance tools to read in the raw data, but working with ASCII output from rtrace should be fine – much better precision than rpict output at least. Were your results improved?
-Greg
Hi Greg,
Yes, with the ASCII output results are a bit more accurate but very similar to the ones obtained with pvalue. Thanks for your suggestion.
Irene