I always see two version of tregenza sky model in the literarure. One is shown as Fig.1, and another is shown as Fig.2. So I want to know which is the definition for the tregenza sky, and which is the generated one with gendaylit?
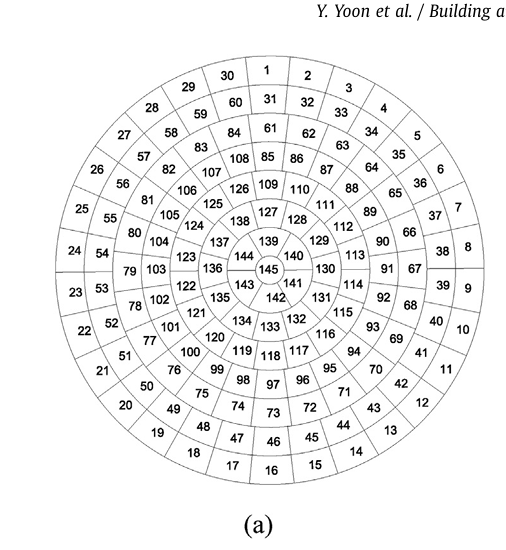
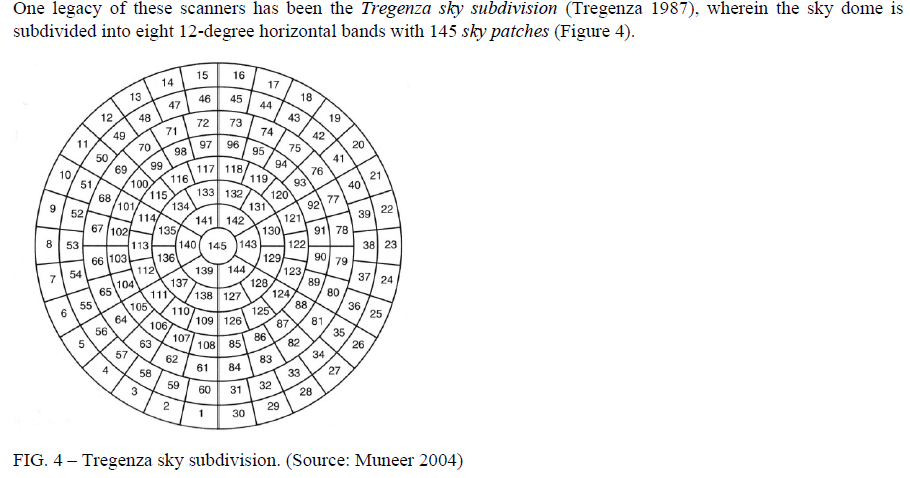
Fig.1
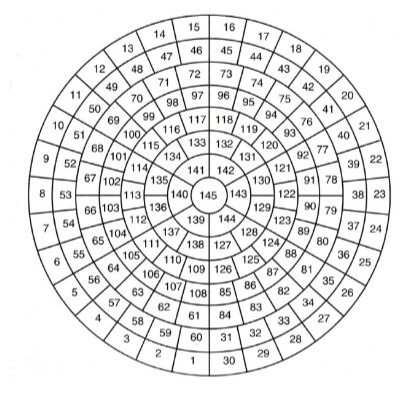
Fig.2
I always see two version of tregenza sky model in the literarure. One is shown as Fig.1, and another is shown as Fig.2. So I want to know which is the definition for the tregenza sky, and which is the generated one with gendaylit?
I don’t know where the second figure comes from, but I believe Fig. 1 is correct. This is what is used in gendaylit and gendaymtx, as well as the other Radiance utilities (such as genskyvec and rfluxmtx). I think Fig. 2 misaligns the azimuth centroids. Where did this come from?
-Greg
Hi 1112,
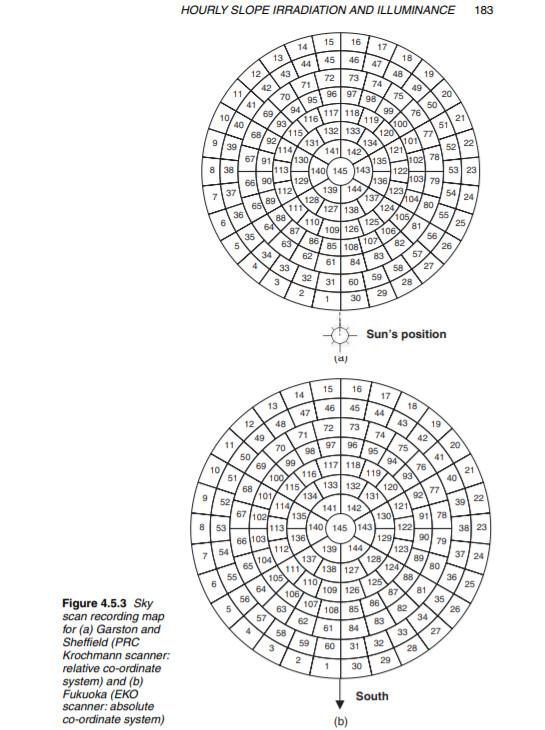
Fig 1 has the correct naming convention for the Tregenza patches. So this probably answers your question.
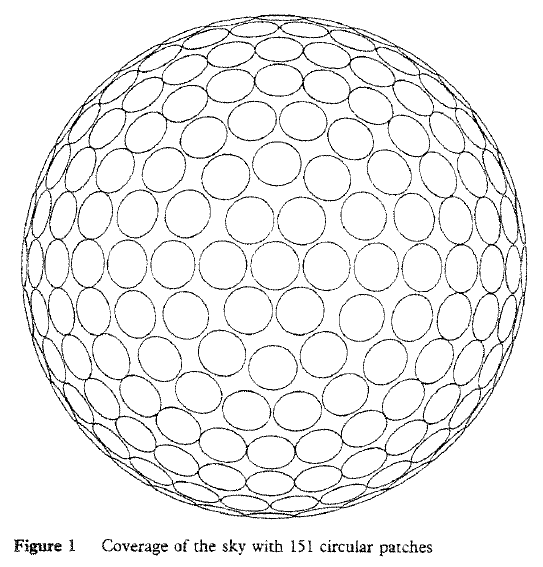
However, the original Tregenza paper from 1987 was about ‘Subdivision of the sky hemisphere for luminance measurements’ (https://journals.sagepub.com/doi/abs/10.1177/096032718701900103 – paywalled, I’m afraid). Peter theoretised how a mechanical sky scanner (with a fixed acceptance angle) mighty work. His initial proposal was to use 151 patches, where the smallest zone diameter would be 11.31 degrees.
In the same paper, he then observes that
“The disadvantages are that the increment of azimuth
between adjacent zones varies between altitude bands, and
that the proportion of the sky covered by patches also
varies slightly. These are characteristic of any geometric
subdivision of a hemisphere into zones of equal area within
parallel bands. A small improvement of total coverage, to
75%, can be achieved with a 12° acceptance angle, provided
that some bands contain an odd number of zones; but this
removes symmetry across one vertical plane. Alternatively,
reducing the number of zones from 32 to 30 in band 1, and
from 28 to 24 in band 3, gives a 3-way symmetry overall.
The azimuth increment is then always an integer, but the
total coverage is reduced to 68%, with greater unevenness.”
So this is how we ended up with 145 zones of 12 degree diameter.
During the IDMP (early 2000s ?), a number of meteorological stations across the globe took regular sky scans based on the 145 Tregenza patches. I was not involved, nor did I have access to the raw data, but I believe the most used sky scanners was made by Kipp and Zonen (https://www.kippzonen.com/).
Whilst their devices did scan the heavens with a 12 degree, 145 patch pattern, I believe (anecdotal evidence, for which I don’t have a citation) that the scan pattern was rotated by 180 degrees, i.e. patch 0 was south-ish. This might well be what your Fig 2 is showing.
Yes, I know – it’s all a bit vague. Sorry I can’t provide more hard evidence than what I have laid out above. Still – you might find it helpful from a daylight-archeological point of view.
Cheers
Axel
Hi Greg,
Fig.2 comes from:
Ian Ashdown. 2016. Climate-Based Daylight Modeling From Theory to Practice. Access: 9/12/2023. Avaiable from: (https://www.researchgate.net/publication/299579402_Climate-Based_Daylight_Modeling.
Thank you, Axel. You answer let me know more history details regarding the tregenza sky.
Interesting – I guess you would need to look up the [Muneer 2004] reference to see if Ian took the figure from there. Sadly, Dr. Ashdown passed away just this year. I don’t know the circumstances, but it was a terrible loss to the lighting research community, and he was a good friend as well.