Hi Radiance Community,
I’m currently working on a project where I compare data from simple weather measurement devices I built (using a very cheap BH1750 lux sensor) with theoretical values under clear sky conditions, using Radiance. The sensor is shielded by a 3D-printed white PLA dome, which I’ve roughly estimated reduces brightness by about 70%, as measured with an iPhone lux meter. The dome has a radius of approximately 3 cm.
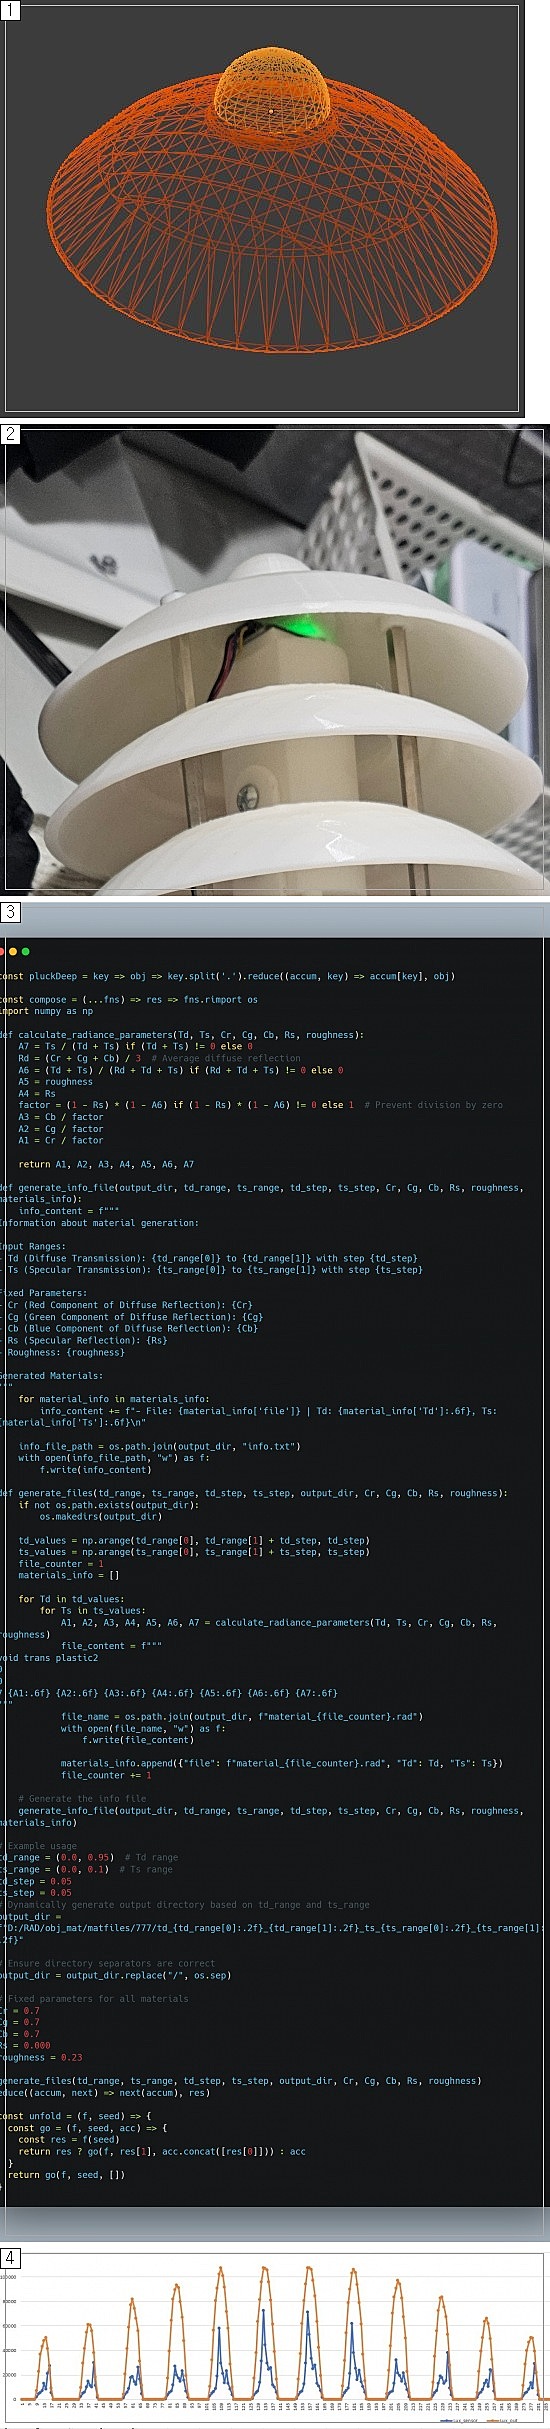
fig1, fig2(newcomers could only include only 1 image so I had put all together in one image)
I’m trying to simulate the shielding effect using Radiance to compare the measured lux values to theoretical results under various clear sky conditions. To model the PLA dome, from reading the RwR textbook I figured `trans’ material would be the likely candidate. As the actual optics of this material was not clear, I made different trans materials with a range of ts and td
fig3
But the results haven’t been satisfactory.
fig4
While the external surfaces around the dome produce realistic parabolic patterns in illuminance, the computed lux values inside the shield (where the sensor is) don’t align with expectations.The results appear abnormal and inconsistent with what I would expect based on the physical measurements.
My advisor suggested exploring BSDF for this purpose. However, most tutorials I’ve found focus on indoor simulations, and I’m unsure how to apply BSDF effectively to this outdoor flat-ground setup. I’m also not sure if BSDF is even appropriate for modeling this kind of shielding effect, as the tutorials seem more focused on window systems or interior lighting.
I’m feeling quite stuck at the moment. How can I accurately model the PLA dome shielding effect for this specific sensor setup? Are there any tips for debugging or improving the sensor area lux calculations to make them align better with physical measurements?
Thanks in advance for your help!
Hi @Kevin_Joh,
Could you provide some more explanation of the graph at the bottom of your figure? Unfortunately, the resolution is too low to read the labels. If my guess that blue is measured illuminance and orange is the illuminance from the theoretical CIE clear sky, then it appears that you did not have uniformly sunny conditions during your measurement period, which is very normal.
You’re probably fine to use a trans material to model the PLA. If possible, you should print a large flat sheet of PLA with the same thickness as your dome and measure ts and td for that sheet, rather than trying to guess.
You could use a BSDF, which is just a material type in Radiance and can be used for any type of simulation. However, this requires that you obtain BSDF measurements with a goniophotometer, which could be quite expensive if you don’t happen to have one, and I doubt it will make much difference.
Hi @Nathaniel_Jones !
Thanks for your insight
To clarify, the blue line represents the illuminance calculated outside of the sensor shield, while the orange line represents the illuminance inside the sensor shield, where the lux sensor is positioned.
Both are simulation result of Radiance.
Sensor’s physical measurements tend to resemble the blue line, lower values due to the shielding, with an occasional outlier values due to microclimate from my guess
Also, just to clarify about the graph: it represents simulations for the first day of each month, covering a total of 12 days for the site.
Model itself seems to be fine. When visualizing the scene piece by piece in rvu, everything appeared as I had designed. Moreover, I’ve run simulations with several variations of trans materials, and the results consistently produced an orange line-like pattern—typically skewed, with the peak not aligned at 12 PM as one might expect under clear sky conditions.
Hi @Kevin_Joh,
Might it be the other way around, that the orange line is measured outside the shield, and the blue line inside?
What settings are you using, specifically for diffuse and direct sampling? Because the sun is a very small source, I suspect that your sampling simply misses it frequently.
hi @Nathaniel_Jones ,
The colors were reversed during merge my apologies.
Sampling setting is
rfluxmtx -I+ -y 39601 -lw 0.001 -ab 100 -ad 25000
I’m not entirely sure if this is what you were asking about… but here it is
Your -lw value should not be greater than 1/ad value. Your -ab 100 is a bit silly, as nothing much happens after 7 or 8 bounces, and you are well into Russian-roulette mode after 2.
-Greg