Hi the community,
I’d like to follow up with the previous post on locating glare sources.
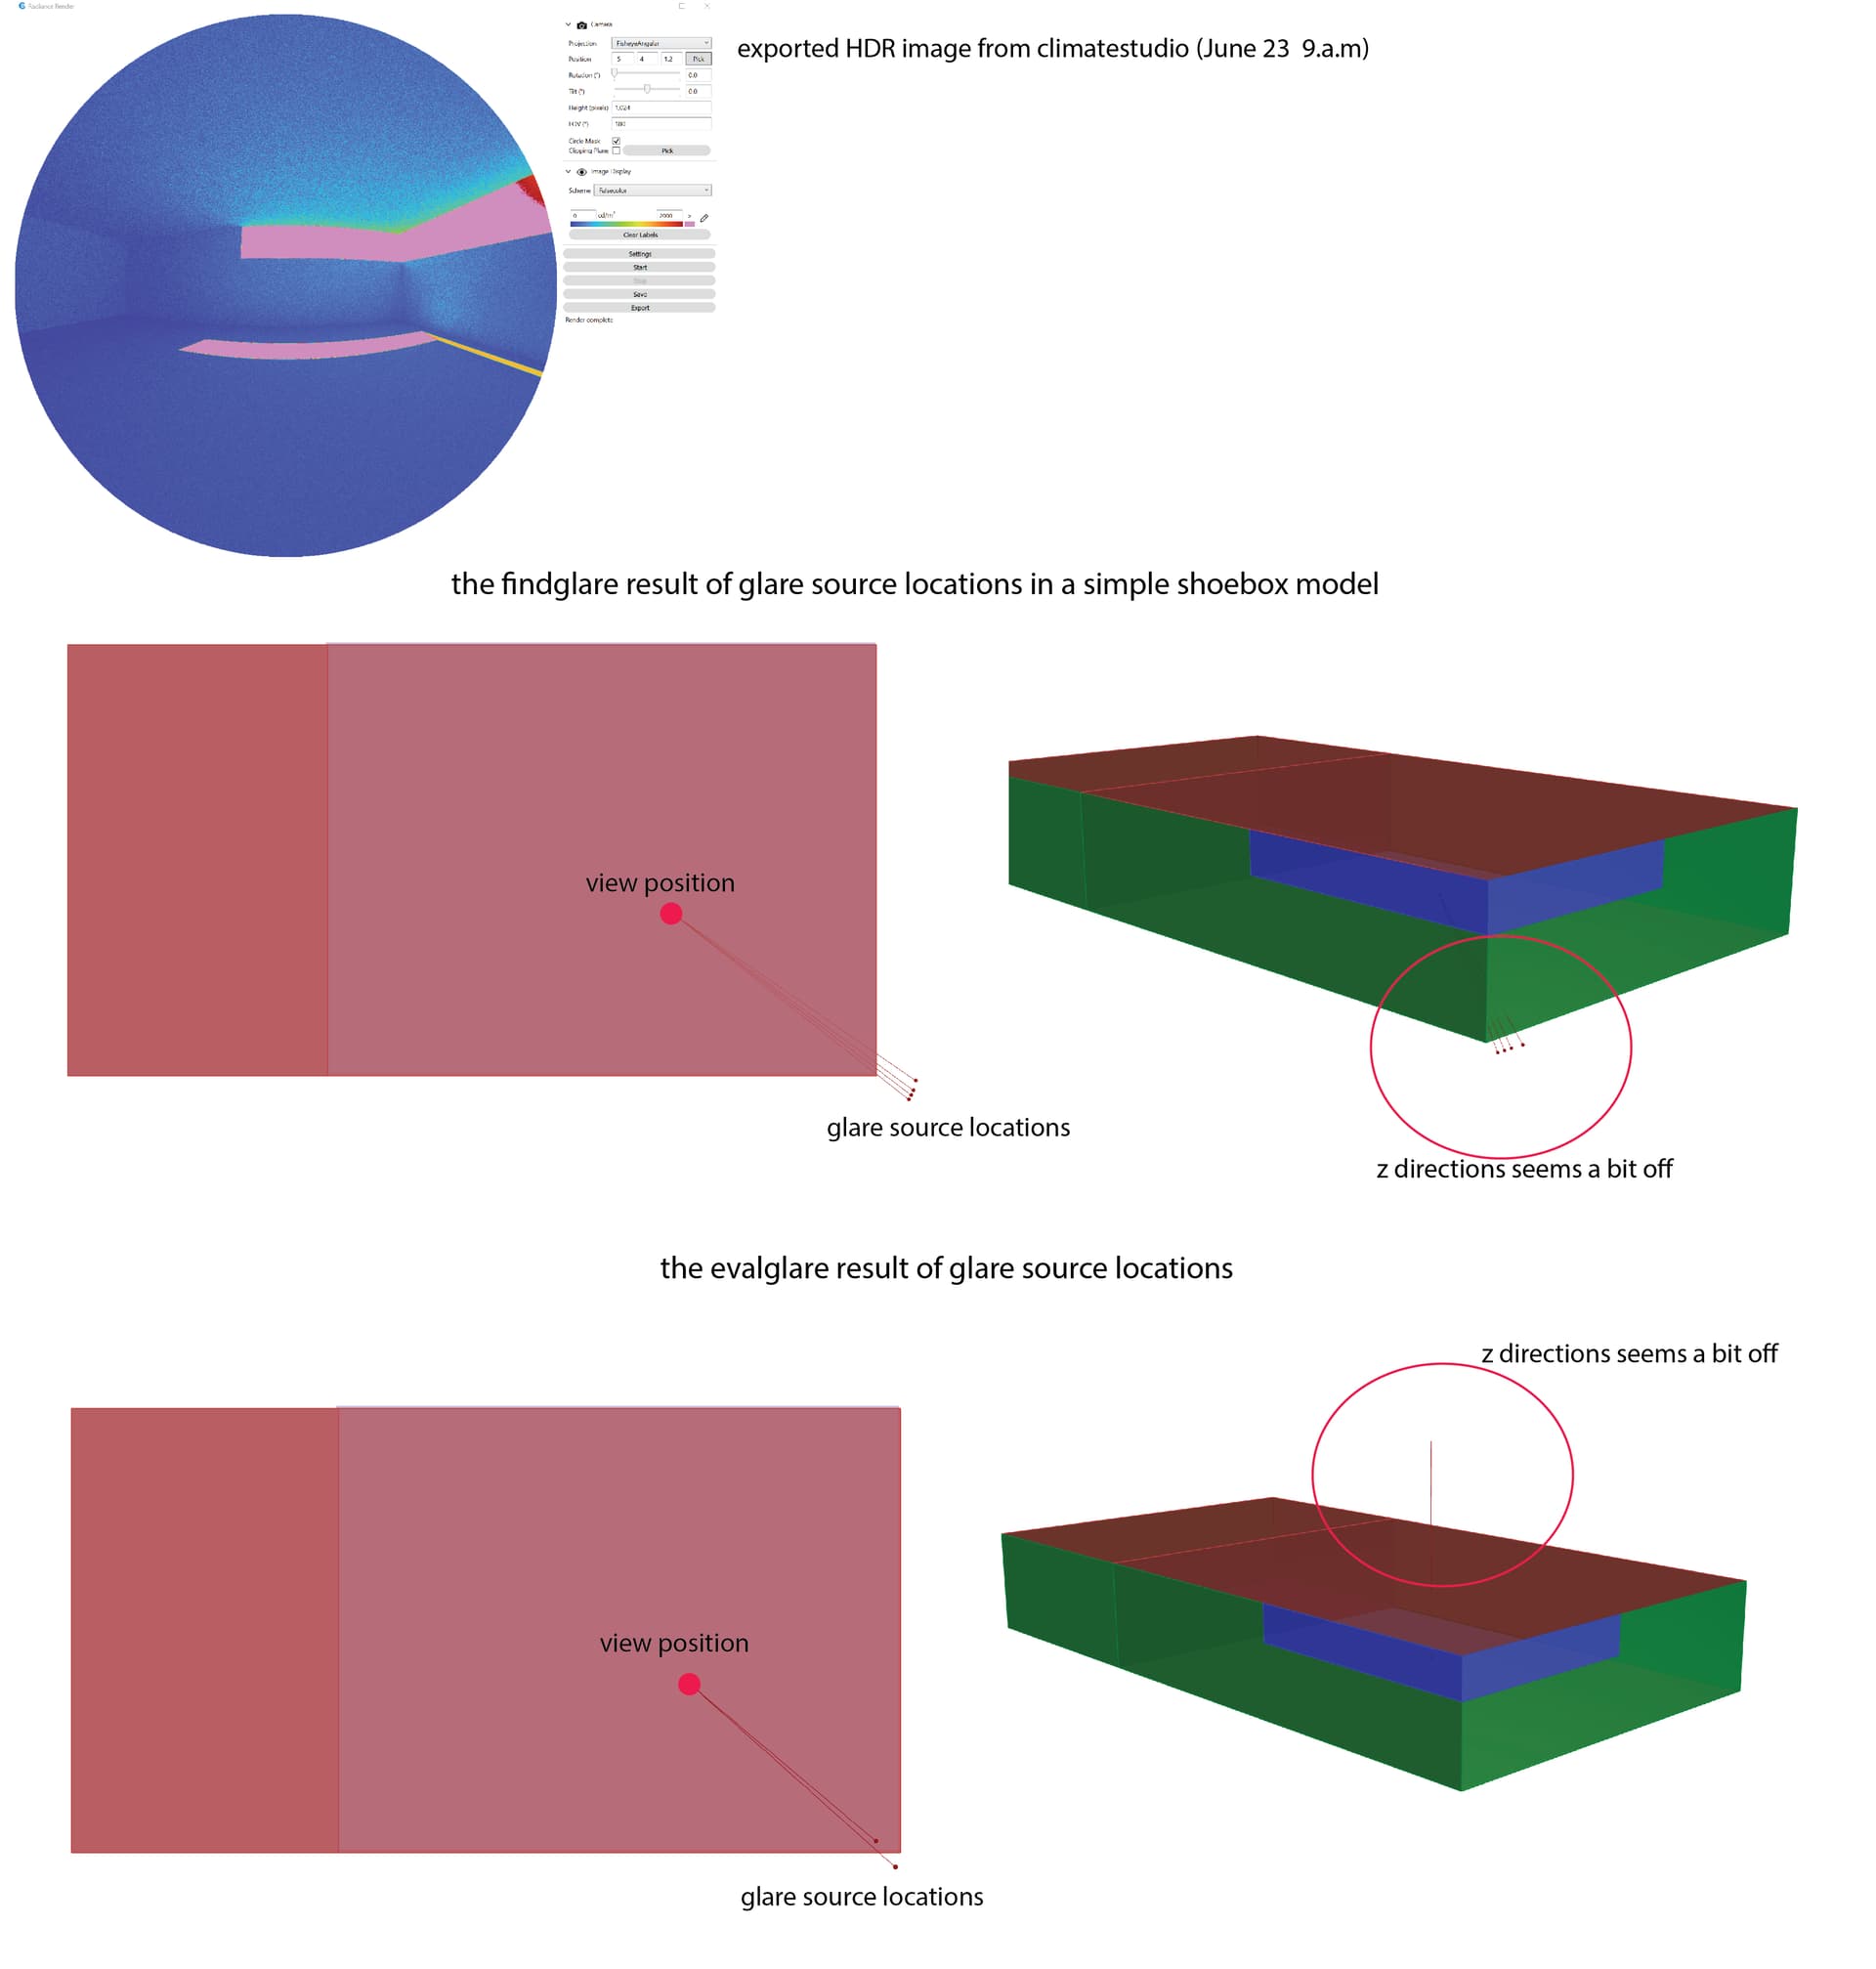
At this time, I attempted to select a view position and created an HDR file from the climate studio and imported it into findglare and evalglare for locating glare sources. I got the output from both programs, as shown below.
findglare
evalglare
Both output files show the x, y, z directions of the glare sources. I was wondering what the reference point(origin) is for these x, y, z directions? Is the selected view position the origin point(0,0,0)? The reason I asked this question is that when I tried to visualize these glare source points in the 3-dimensional space, the locations are a bit off, especially the z directions for both. Also, the outputs of glare sources slightly differ between the two programs.
Probably I totally misunderstand the meaning of XYZ directions at all. My purpose is to map glare sources on the building facades in Rhino.
Many thanks in advance!
Hi,
the x,y,z direction-vector starts always from the viewpoint, which is in your case (-5 4 1.2 ).
For the tabular output of evalglare you are wrong by one column for you headerline… So in your example, the first glare source is located in the direction of 0.92701 -0.1212 -0.35468 .
And yes, the output can differ of course. Evalglare has a different default glare source detection algorithm implemented (fixed threshold 2500cd/m2), but could be set to the same as findglare (7x more than average luminance, using -b 7 option and not using -t or -T, see man page). Secondly the way glare source pixels are put together to glare sources is also different and can cause different outputs.
hope that helps,
Jan
Hi Jan, a followup here! When did -b’s default switch to 2500 cd/m2? I’ve assumed it is 2000 cd/m2 based on the evalglare_v2.07.pdf that comes with v2.09 and Clotilde Pierson’s paper. Is there a reference for this?
Thanks!
Hi Alstan,
Sorry, this was a typo! The the default setting has not changed and is set to a fixed threshold of 2000cd/m2.
sorry for the confusion.
Cheers
Jan
1 Like
Dear Jan,
Thank you so much for the help and forgive my mistakes on the header!
May I ask another question about the glare source? Right now the glare source is visualized as points. Is it possible that I can use any info in the output to visualize them as areas or shapes?
Thanks
Joe
Dear Alstan,
Thanks for pointing out this as well that I can learn from.