Thanks @Greg_Ward and @Lars_Grobe! I had to change the latter $1 in the rcalc command to be $3 to work. Your tip about pcomb and the l key is a great way to quickly check average illuminances!
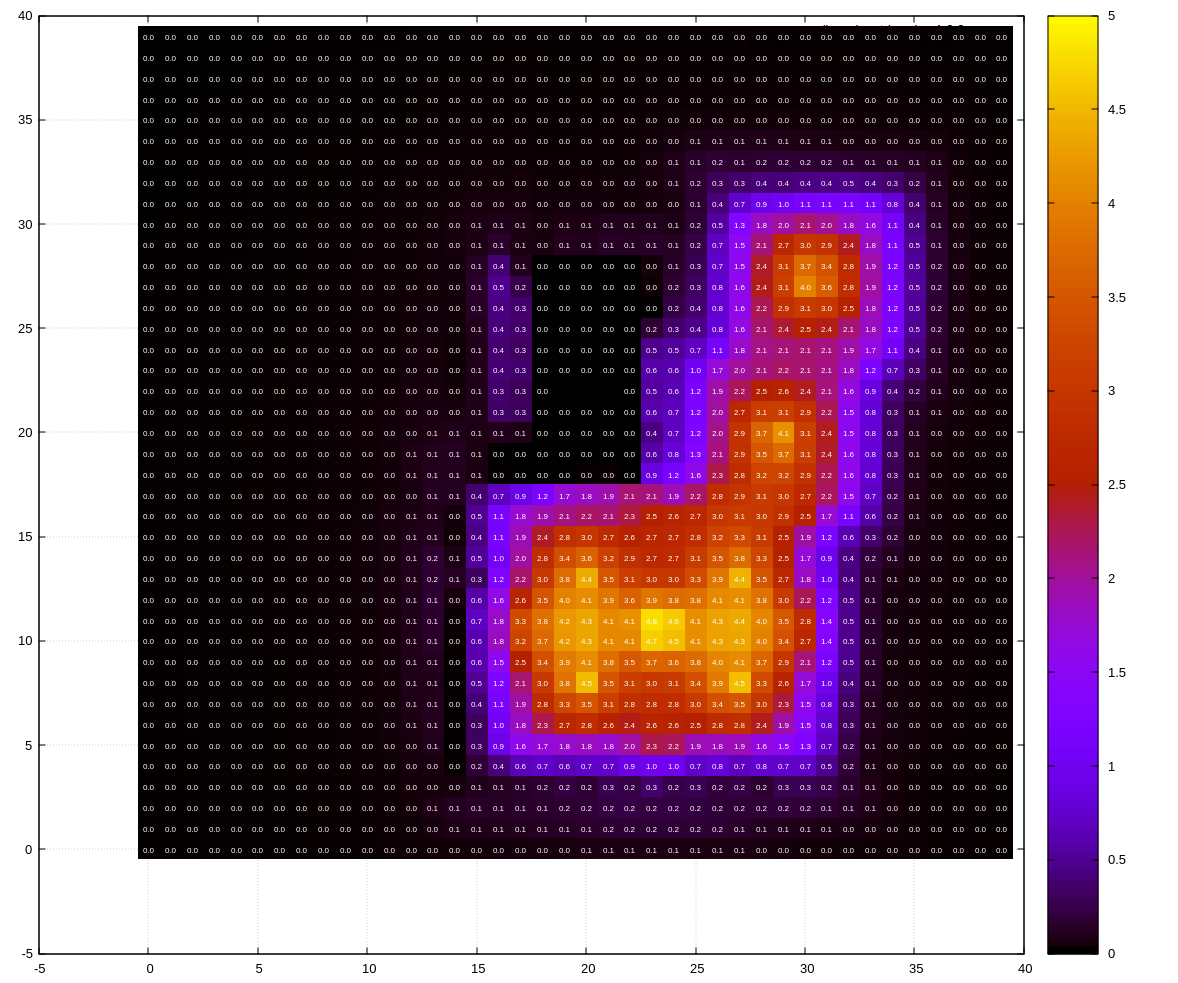
I’ve combined both the pfilt method as gnuplot as follows to create a 15 by 15 px heatmap. This results in 40 rows for a 600px foo.hdr input file. Hence there are 40 dashes in the paste command. gnuplot looks incredibly full of potential and I will need to dig further into how to use it in the future!
$ pfilt -1 -x /15 -y /15 foo.hdr | pvalue -h -H -o -b | rcalc -e '$1=179/10.76*$3' > data
$ paste - - - - - - - - - - - - - - - - - - - - - - - - - - - - - - - - - - - - - - - - -d' ' < data > data-matrix-flipped
$ tac data-matrix-flipped > data-matrix
$ gnuplot
> plot 'data-matrix' matrix using 1:2:3 with image, \
> 'data-matrix' matrix using 1:2:($3 == 0 ? "" : sprintf("%2.1f",$3) ) with labels textcolor 'white' font ', 5'
This gives a result like so. (Edit: note that this image is a different simulation than the one in my first post, so they look different  )
)