Hi Greg,
thank you for giving some insight on hdrgen...!
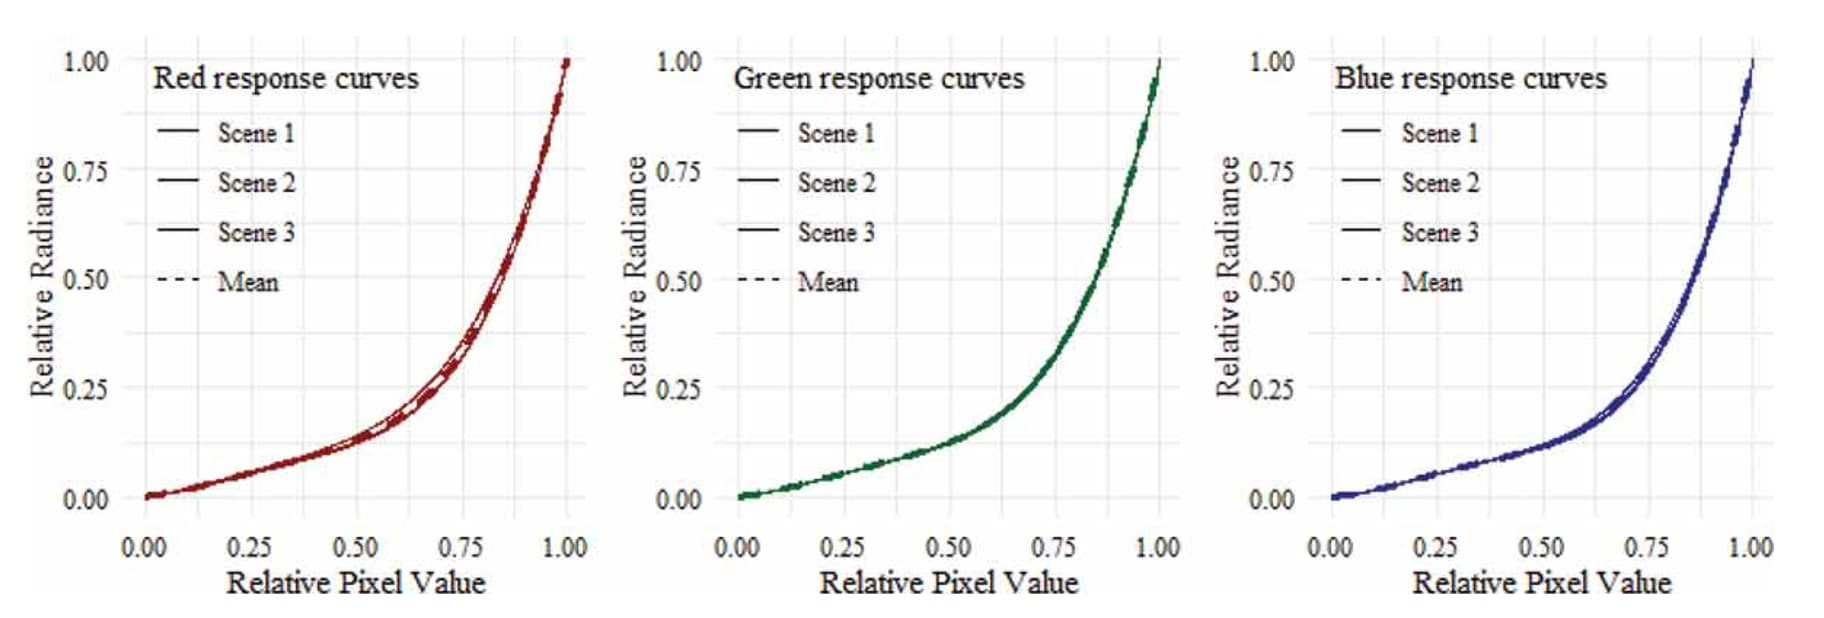
There are no units for the sensor response function, which isn't
luminance, but individual responses for the three color channels
(red, green, and blue). Sadly, even these are mixed up, since there
is a non-linear (and unknown) color transform between the sensors RGB
and the image RGB values.
I understood the graphs / curves that I see response dependant on
luminance? If I draw the curve as a graph, and I write "response" to the
y-axis, what is the label for the x-axis in this case?
BTW, most of the accuracy from HDR sequences is unrelated to the
derived camera response.
I can confirm this, as even the most awful response data gives only
slightly different results when taking pixel values from the generated
HDR, as far as I could experience 
Rather, it's from the proper combining of
closely-spaced exposures with accurately reported ISO, speed, and
aperture. If those things are not reported correctly by the camera,
then all bets are off. Other things that undermine accuracy are lens
flare (trying to measure a dark area near a bright one or with direct
light entering the camera), and vignetting for wide apertures.
Absolute response is also a big issue, which is why you should
probably have at least one luminance reading from each captured scene
if the actual values (and not just relative values) matter to you.
I have a fixed lense (no zoom etc), I am trying to correct for
vignetting, aperture is fixed, flare should not appear on the images
taken (rather uniform gradients), and I created a HDR of a known
calibrated light source under the same settings, allowing me to estimate
the factor between reported luminance from the HDR and "real" luminance
(according to the calibrated light source used). So I try to handle
these uncertainties. I wanted to document the differences in the tools
used, and one of the main differences between hdrgen and pfstools seams
to be the response-curve fitting. So it would be great to be able to
overlay the curves (six curves all in all, three channels for both tools
each). But I do not really know how the function is applied to which
datasets.
CU Lars.