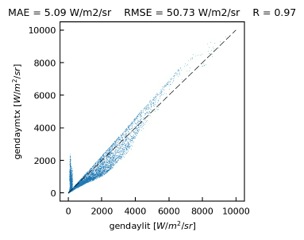
Mmm… I used the units as specified in the man page for gendaylit, it says the default output is in W/m2/sr. All the 146 patches are plotted in the graph, at all time steps during daylight time (there are 146 x 4586 points).
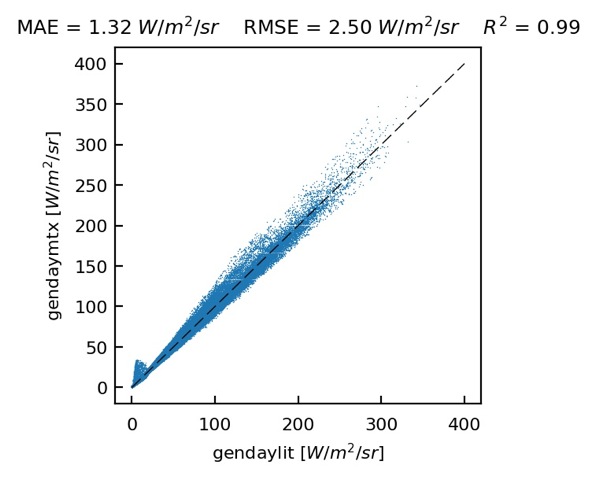
Running exactly the same analysis without the sun in the sky description (-s option in both gendaylit and gendaymtx) led to a more symmetric correlation (attached).
Maybe the assignment of the sun contribution to the three nearest sky patches is done slightly differently in genskyvec and in gendaymtx?
···
From: Jan Wienold <[email protected]<mailto:[email protected]>>
Subject: Re: [Radiance-general] gendaylit vs gendaymtx
Date: 15 May 2017 08:56:38 BST
To: <[email protected]<mailto:[email protected]>>
Hi Eleonora,
thanks for evaluating this!
Are you sure about the units? 2000W/m2/sr would mean more than 350000 cd/m2. On the other hand, if the graph would show luminance, then this must be just one patch looking to the north? Already for the timestep you sent (with low irradiation data) it gives me more than 30000 cd/m2 close to the sun position (using gendaylit).
Besides the units (I assume you plot cd/m2 for one patch towards the north), looking at the graph I think it is necessary to look into that deeper to find out the reasons for the deviations. As far as I can see this is not caused by the routines we added to gendaylit in order prevent problems around sunset/sunrise.
A high r2 does not mean there is no problem- looking at the figure you can see a systematic behavior: at high values, gendaymtx delivers higher values than gendaylit, for lower ones it is the opposite. The vertical line for low gendaylit values could be caused by the sunrise/sunset corrections. Especially for the lower values around 2000 there seems like a deviation around 40-50% between the two implementations - this is definitely too much. Actually the implementation should really deliver the same values (except for the sunrise/sunset) - of course rounding/variable types and so on could lead to some small deviations, but not like this and also not as systematic like this.
cheers
Jan
On 13/05/17 18:16, Eleonora Brembilla wrote:
Thanks Greg and thanks Jan.
Jan, I had a look at your presentation and tried a comparison with the -i 60 option in gendaylit, but that did not improve much the correlation with gendaymtx.
Over the whole year the differences are really not that big, the coefficient of correlation for the London wea file is 0.97. Only cause I was expecting identical results, I was worried I had left something out in the gendaylit command options, that might have been important.
I attached a scatter plot with the results for the whole year, and a temporal map with the R coefficient over the sky patches for each hour. Some of the ‘worst' correlations (still minor) are for high sun angles.
The wea I used was derived from the epw available from the Energy Plus website, using epw2wea (https://energyplus.net/weather-location/europe_wmo_region_6/GBR/GBR_London.Gatwick.037760_IWEC).
Thanks again
Eleonora
<Mail Attachment.jpeg>
From: Jan Wienold <[email protected]<mailto:[email protected]>>
Subject: Re: [Radiance-general] gendaylit vs gendaymtx
Date: 12 May 2017 17:25:19 BST
To: <[email protected]<mailto:[email protected]>>
Hi Eleonora,
I had a presentation at the radiance workshop in Boulder (uff I think this was in 2013) - there you can find how gendaylit treats "problematic" cases (close to sunrise and sunset).
I assume (and hope), that the differences are only for these hours. The core code of gendaylit was checked several times against the publication from R. Perez and was not changed in the last 20years.
best,
Jan
On 05/12/2017 05:25 PM, Greg Ward wrote:
Hi Eleonora,
The gendaymtx command and gendaylit are separate implementations based on the Perez model with no code in common. The gendaylit program was developed first, long ago by Jean-Jacques Delaunay, then more recently expanded, updated and improved by Jan Wienold and Wendelin Sprenger. In contrast, the gendaymtx program was derived a few years ago from C code provided by Ian Ashdown. The two programs have been spot-checked against each other, but as far as I know, no one has done a thorough comparison of either the methods or the outputs to ensure they behave the same. In fact, there is some room for interpretation in Perez's model, and numerous places where exceptional values must be caught and dealt with. Finally, I don't think all the options of gendaylit are included in gendaymtx.
If you can be more specific by checking when, where and by how much your output vectors differ, this would help. Or at the least, attach the relevant part(s) of your London weather file so we can check ourselves.
Cheers,
-Greg
From: Eleonora Brembilla <[email protected]<mailto:[email protected]>>
Date: May 12, 2017 8:16:18 AM PDT
Hi everyone!
I have a doubt on how gendaymtx works. Or better, what’s the difference between the Perez model implementation in gendaymtx and in gendaylit?
I was comparing the output of these two methods, for each hour of the year:
gendaymtx -m 1 GBR_London.wea > London.dmx
gendaylit 1 4 9.5 -a 51.15 -o 0.18 -m -0 -W 178 76 | genskyvec -m 1 > london_0104h9_rad.skv
And I was expecting to get an identical result, but instead the two data series are somehow different. The data I used for the gendaylit -W option are taken from the same .wea file I used for gendaymtx.
Sorry if you discussed about this previously, I searched a bit in the mailing list but I didn’t find a precise answer.
Thanks a lot!
Eleonora
Eleonora Brembilla, MSc
PhD Student
Building Energy Research Group
Daylight and CBDM
School of Civil & Building Engineering
Loughborough University
LE11 3TU
UK
@EleBrembilla<https://twitter.com/EleBrembilla>
_______________________________________________
Radiance-general mailing list
[email protected]<mailto:[email protected]>
https://www.radiance-online.org/mailman/listinfo/radiance-general
--
Dr.-Ing. Jan Wienold
Ecole Polytechnique Fédérale de Lausanne (EPFL)
EPFL ENAC IA LIPID
http://people.epfl.ch/jan.wienold
LE 1 111 (Office)
Phone +41 21 69 30849
_______________________________________________
Radiance-general mailing list
[email protected]<mailto:[email protected]>
https://www.radiance-online.org/mailman/listinfo/radiance-general
_______________________________________________
Radiance-general mailing list
[email protected]<mailto:[email protected]>
https://www.radiance-online.org/mailman/listinfo/radiance-general
--
Dr.-Ing. Jan Wienold
Ecole Polytechnique Fédérale de Lausanne (EPFL)
EPFL ENAC IA LIPID
http://people.epfl.ch/jan.wienold
LE 1 111 (Office)
Phone +41 21 69 30849
_______________________________________________
Radiance-general mailing list
[email protected]<mailto:[email protected]>
https://www.radiance-online.org/mailman/listinfo/radiance-general